Power BI dashboard
E-commerce Sales Dashboard: store, ads and customers in one view
Brings store sales, ad spend and website traffic into one report, with a churn risk score for each customer.
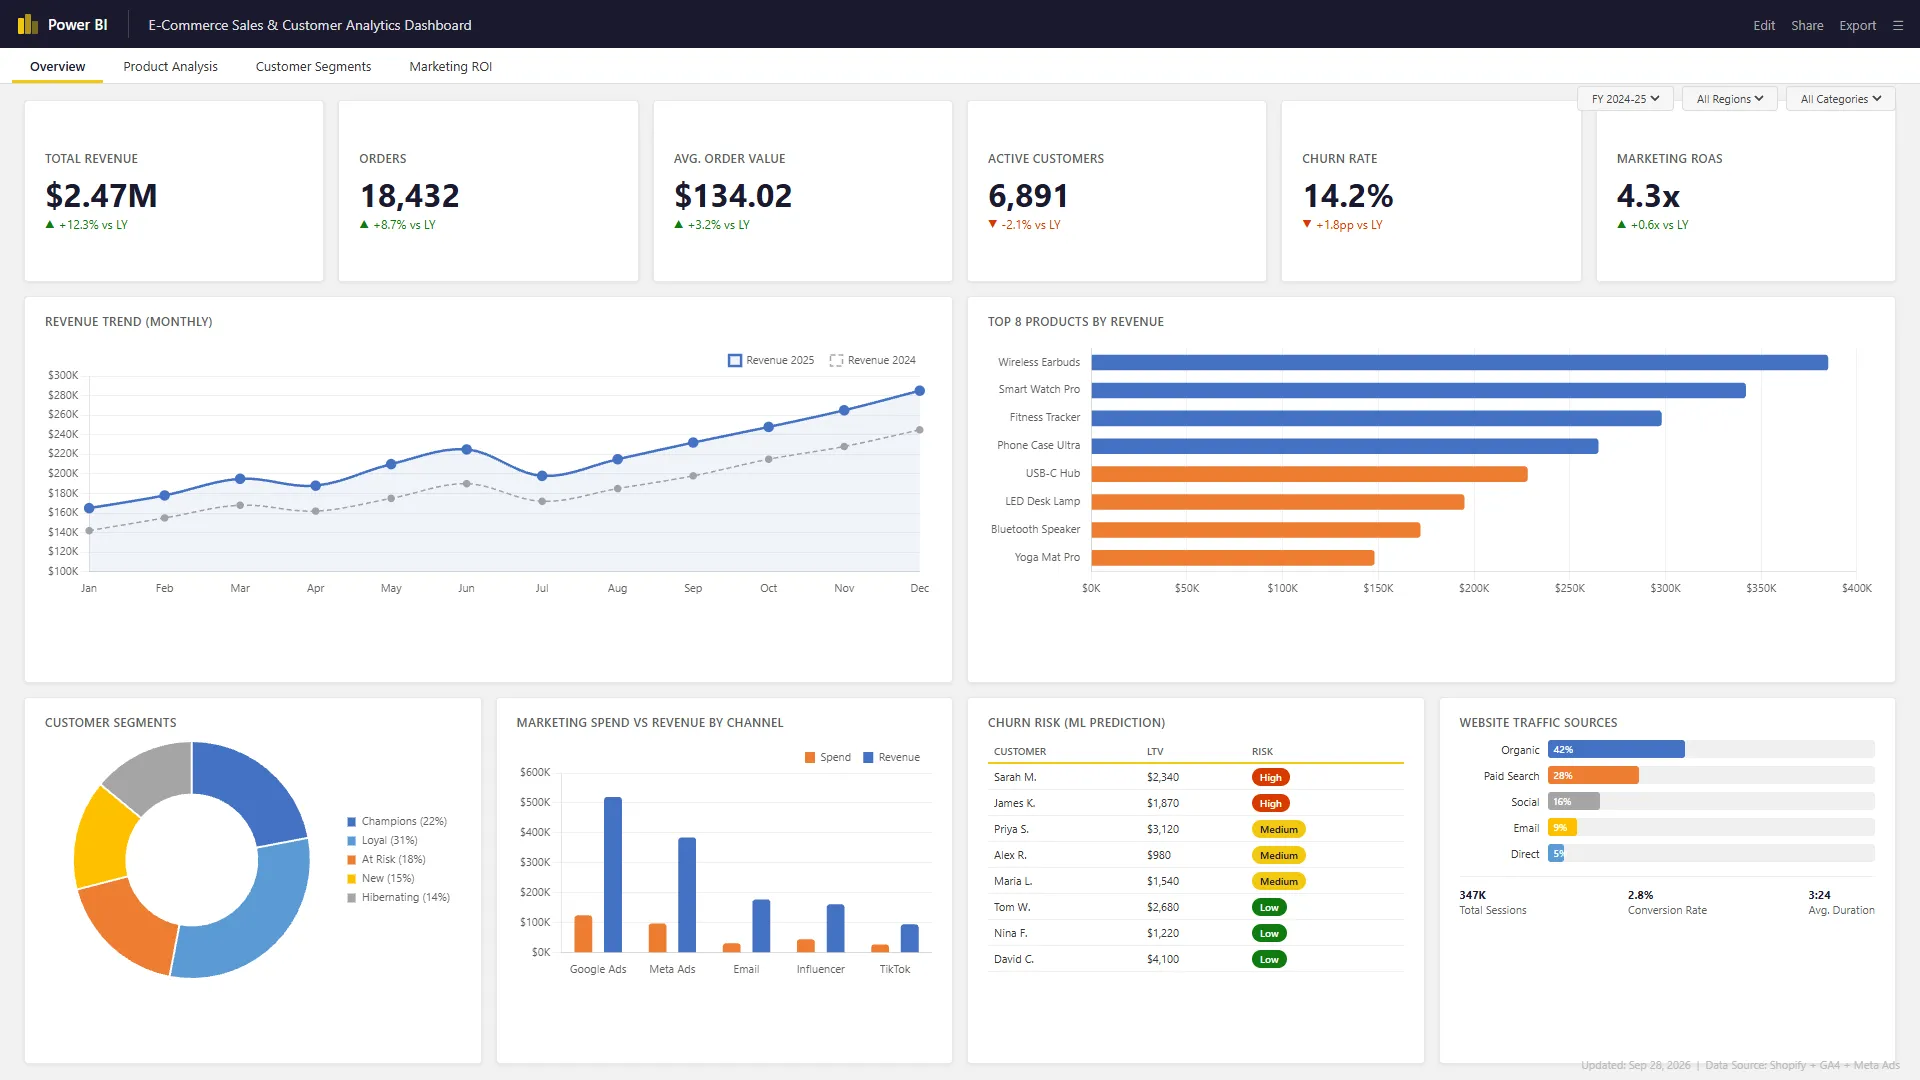
Demo build with sample data. Names and figures are made up.
The problem
An online store has sales in Shopify, traffic in Google Analytics and ad spend in Meta. The owner cannot easily see which channels and products actually make money.
What we built
- A data model joining Shopify orders, Google Analytics sessions and Meta Ads spend
- An overview page with revenue, orders, average order value, churn rate and return on ad spend
- Customer segments such as champions, loyal, at risk and new
- A churn risk table that lists high value customers who are likely to stop buying
What this project shows
- Combining data from several tools into one model with matching totals
- Designing a page that answers the main questions at a glance
More work
- HR Attrition Predictor Power BI dashboard and ML model
- DocuMind AI Document Assistant GenAI document Q&A
- FlowBoard Project App Custom web app
Free 30 minute call
Want something like this for your business?
Book a free 30 minute call. We will look at your problem, tell you honestly whether AI or data work can help, and send a short written plan if it can.